Tutorials
- Category: Tutorials
As mentioned in Part 1, the value of the fault loop impedance shall be able to generate enough fault current to activate any protective device.
What does this mean? The earth fault current must be high enough to trigger the automatic disconnection of a protective device within an specified time. If the value of the earth fault current is not within the tripping current of the protective device, then there will be no means of protective device will provide protection against touch voltage. At the location of the fault, there is a possibility that the full voltage is present in the equipment enclosure posing hazard to people with the increased touch voltage higher than 50 Vac.
- Category: Tutorials
What is "Earth Fault-Loop Impedance"? Why is it important?
Standards define "Earth Fault-Loop Impedance" as the impedance of the earth fault-current loop (active-to-earth loop) starting and ending at the point-of-earth fault.
It is important to know the earth fault-loop impedance of a circuit to ensure that during the occurence of a phase-to-earth fault, normally an insulation fault, the magnitude of the fault current is enough to cause the operation of the protective device within the required time particularly where the touch potential exceeds 50V a.c. or 120V ripple-free d.c.
- Category: Tutorials
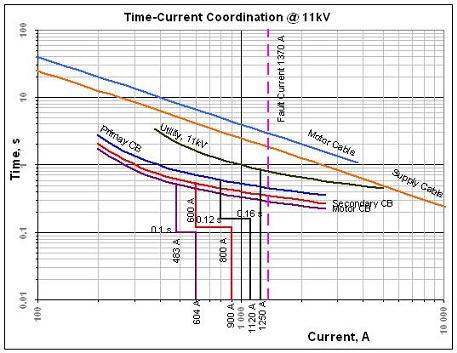
This is the final part of the tutorial creating for time-current current curves with Excel. We shall be able to attain a complete relay coordination similar to this following curve.
- Category: Tutorials
In this tutorial, we shall be able to create Normal Inverse curves from the formula given below (IEC). This formula has been used in so many coordination studies world wide. You can actually use it to coordinate your protection settings with your power supplier. Normally the time setting for the network protection will be provided by the power supplier. We shall be discussing this on the next tutorial.

Time-Current Formula
where
k = time, s
α, β = constants, see table below
I = Input Current
IO = Pickup setting
- Category: Tutorials
In this part of the tutorial, we shall be able to produce a Normal Inverse time-current curve. Given the values below, we will be plotting the values on an XY Scatter graph with data points connected without markers.
| I (A) | t (s) |
|---|---|
| 600 | 2.75 |
| 800 | 1.60 |
| 1200 | 1.01 |
| 1600 | 0.80 |
| 1600 | 0.80 |
| 1600 | 0.14 |
| 4800 | 0.14 |
| 4800 | 0.10 |
Try plotting the values and I presume that you will be getting a graph similar to Figure 1.

Figure 1