In this part of the tutorial, we shall be able to produce a Normal Inverse time-current curve. Given the values below, we will be plotting the values on an XY Scatter graph with data points connected without markers.
| I (A) | t (s) |
|---|---|
| 600 | 2.75 |
| 800 | 1.60 |
| 1200 | 1.01 |
| 1600 | 0.80 |
| 1600 | 0.80 |
| 1600 | 0.14 |
| 4800 | 0.14 |
| 4800 | 0.10 |
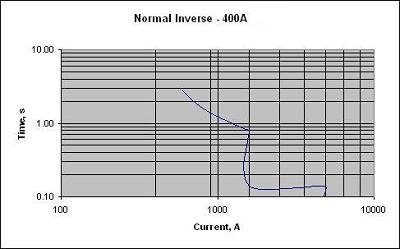
Try plotting the values and I presume that you will be getting a graph similar to Figure 1.

Figure 1
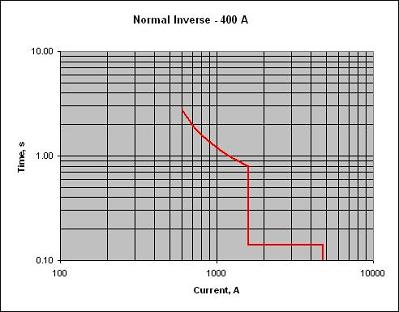
To plot a graph similar to Figure 2, the technique is to chunk the data into separate data series.
| I (A) | t (s) |
|---|---|
| 600 | 2.75 |
| 800 | 1.60 |
| 1200 | 1.01 |
| 1600 | 0.80 |
| I (A) | t (s) |
|---|---|
| 1600 | 0.80 |
| 1600 | 0.14 |
| I (A) | t (s) |
|---|---|
| 1600 | 0.14 |
| 4800 | 0.14 |
| I (A) | t (s) |
|---|---|
| 4800 | 0.14 |
| 4800 | 0.10 |

Figure 2
As I have said in the first part of this tutorial, I presume that you know how to use MS Excel. In the next part, we shall be learning about how to calculate curves for normal inverse, very inverse, extreme inverse and long time inverse.